The article is about the use and application of split plot design in Agriculture, here we will discuss the conditions in which split plot design should be used in agriculture, the related real-life examples of split plot design, and the model of the design. In factorial experiments, there are certain situations where it becomes difficult to handle all the combinations of different levels of the factors. This may be because of the following reasons:
- The nature of the factors may be such that levels of one factor require large experimental units as compared to the levels of other factors. For example, If the two factors are Rowing Methods and Nitrogen Levels”, then in the two-factor experiment the rowing methods require machinery, so they require large experimental units, and the nitrogen levels can be applied to the smaller units.
- Greater precision may be required for levels of one factor as compared to the levels of other factors. For example, If we want to compare two factors, varieties, and fertilizers, and more precision is required for fertilizers, then varieties would be in the larger units and the fertilizers would be in the smaller units.
- It may be that new treatments have to be introduced into an experiment that is already in progress.
Conditions in which Split Plot Design Used
The split plot design (and a variation, the split block) is frequently used for factorial experiments in which the nature of the experimental material or the operations involved makes it difficult to handle all factor combinations in the same manner.
- If irrigation is more difficult to vary on a small scale and fields are large enough to be split, a split-plot design becomes appropriate.
- Usually used with factorial sets when the assignment of treatments at random can cause difficulties, large-scale machinery can required for one factor but not another irrigation and tillage.
- Plots that receive the same treatment must be grouped.
- Degree of Precision: For greater precision for Factor $B$ than for factor $A$, the factor $B$ should be assigned to the subplot and factor $A$ to the main plot.
- Relative Size of the Main Effects: If the main effect of (say factor $B$) is much larger and easier to detect than that of the other factor (factor $A$), the factor $B$ can be assigned to the main plot, and factor $A$ to the subplot. This increases the chance of detecting the difference among levels of factor $A$ which has a smaller effect.
- Management Practices: The cultural practices required by a factor may dictate the use of large plots. For example, in an experiment to evaluate water management and variety, it may be desirable to assign water management to the main plot to minimize water movement between adjacent plots, facilitate the simulation of the water level required, and reduce border effects.
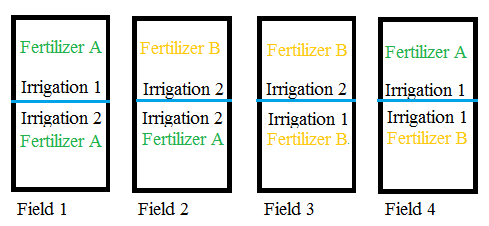
Split Plot Design in Agriculture: Irrigation and Fertilizer (Example 1)
In agricultural experiments involving two factors “irrigation” and “nitrogen” fertilizer. Sometimes, it is very convenient to apply different levels of irrigation to small neighbouring plots but there is no such difficulty for the application of different levels of nitrogen fertilizer. To meet such situations, it is desirable to have different sizes of the experimental units in the same experiment. For this purpose, we have two sizes of the experimental units. First, a design with bigger plots is taken to accommodate the factors that require bigger plots. Next, each of the bigger plots is split into as many plots as the number of treatments coming from the other factors.
The bigger plots are called main plots. The treatments allotted to them are called main plot treatments or simply main treatments. The consequent parts of the main plots are called sub-plots or split plots and the treatments allotted to them are called sub-plot treatments. The different types of treatments are allotted at random to their respective plot. Such a design is called split-plot design.
Split Plot Design in Agriculture: Irrigation and Fertilizer (Example 2)
Let there be 3 levels of irrigation prescribing 3 different amounts of water per plot and 4 doses of nitrogen fertilizer.
First, a randomized block design with a suitable plot is taken with 3 levels of irrigation as treatments say with 5 replications of the design. The irrigation treatments are then allotted at random to each five blocks, each consisting of 4 sub-plots.
Next, each of these main plots is split into 4 sub-plots to accommodate the 4 levels of nitrogen. The main 15 plots serve as 15 replications of the subplot treatments. Treatments are allotted at random to sub-plots of each of the main plots. The split-plot design is the combination of two or more randomized designs depending on several factors, such as the plots of one design from the block of another design. The main plot treatment or the levels of one factor or different factors each of which requires a similar plot size.
Model of Split Plot Design
\begin{align} y_{ijk} &= \mu + \tau_i + \beta_j + (\tau \beta){ij} + \gamma_k + (\tau \gamma){ik} + (\beta\gamma){jk}+(\tau \beta\gamma){ijk} + \varepsilon_{ijk}\\
i &= 1,2,\cdots, a \text{ levels of factor } A\\
j &= 1,2,\cdots, b \text{ levels of factor } B\\
k &= 1,2,\cdots, c \text{ levels of factor } C
\end{align}
Model Terms
- Linear Terms
- $\mu$: Overall mean
- $\tau_i$: Effect of $i$th level of $A$
- $\beta_j$: Effect of $j$th level of $B$
- $\gamma_k$: Effect of $k$th level of $C$
- Interactions Terms
- $(\tau \beta){ij}$: Interaction effect of $A$ and $B$\ $(\tau \gamma){ik}$: Interaction effect of $A$ and $C$\
- $(\beta\gamma){jk}$: Interaction effect of $B$ and $C$\ $(\tau\beta\gamma){ijk}$:Interaction effect of $A$, $B$ and $C$ \item \textbf{Error} $\varepsilon{ijk}$: Random error at $i$th level of $A$, $j$th level of $B$ and $k$th level of $C$\
- $\varepsilon_{ijk} \sim NID(0,\sigma_{\varepsilon}^2)$
- Response
- $y_{ijk}$: Response of $i$th level of $A$, $j$th level of $B$ and $k$th level of $C$
