In this post, we will discuss Type I Type II error examples from real-life situations. Whenever sample data is used to estimate a population parameter, there is always a probability of error due to drawing an unusual sample. Two main types of error occur in hypothesis tests, namely type I and type II Errors.
Table of Contents
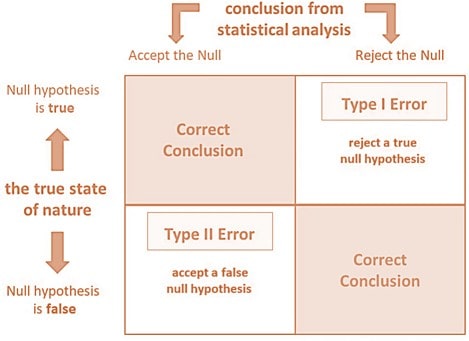
Type I Error (False Positive)
It is rejecting the null hypothesis ($H_0$) when it is actually true. The probability of Type I Error is denoted by $\alpha$ (alpha). The most common values for type I error are: 0.10, 0.05, and 0.01, etc. The example of Type I Error: A medical test indicates a person has a disease when they actually do not.
Type II Error (False Negative)
Type II Error is failing to reject the null hypothesis ($H_0$) when it is actually false. The probability of Type II Error is denoted by $\beta$ (beta). The power of the test is denoted by $1-\beta$, which is the probability of correctly rejecting a false null hypothesis. The example of a Type II error is: A medical test fails to detect a disease when the person actually has it.
Comparison Table
| Error Type | What Happens | Reality | Risk Symbol |
|---|---|---|---|
| Type I | Reject H₀ when it is true | $H_0$ is true | $\alpha$ |
| Type II | Fail to reject $H_0$ when it is false | $H_1$ (alternative) is true | $\beta$ |
| $H_0$ True | $H_0$ False | |
|---|---|---|
| $H_0$ Rejected | Type I Error | Correct Decision |
| $H_0$ Not Rejected | Correct Decision | Type II Error |
Type I Type II Error Example (Real-Life Examples)
- Medical Testing
- Type I Error (False Positive): A healthy person is diagnosed with a disease. It may lead to unnecessary stress, further tests, or even treatment.
- Type II Error (False Negative): A person with a serious disease is told they are healthy. It may delay treatment and worsen health outcomes.
In this case, the more severe error is a Type II error, because missing a true disease can be life-threatening.
- Court Trial (Justice System)
- Type I Error: An innocent person is found guilty. It leads to punishing someone who did nothing wrong.
- Type II Error: A guilty person is found not guilty. It led to the criminal going free.
In this example, the more severe is often Type I, because the justice system typically aims to avoid punishing innocent people.
- Fire Alarm System
- Type I Error: The alarm goes off, but there’s no fire. Therefore, a false alarm causes panic and interruption.
- Type II Error: There is a fire, but the alarm does not go off. It can cause loss of life or property.
The more severe error is Type II error, due to the potential deadly consequences.
- Spam Email Filter
- Type I Error: A legitimate email is marked as spam. It means one will miss important messages.
- Type II Error: A spam email is not caught and lands in your inbox. The spam email may be a minor annoyance or a potential phishing risk.
The more severe error in this case is usually Type I, especially if it causes loss of critical communication (like job offers, invoices, etc.).
- Quality Control in Manufacturing
- A factory tests whether its products meet safety standards. The null hypothesis ($H_0$) states that the product meets requirements, while the alternative ($H_1$) claims it is defective.
- Type I Error (False Rejection): If a good product is mistakenly labeled defective, the company rejects a true null hypothesis ($H_0$), leading to unnecessary waste and financial loss.
- Type II Error (False Acceptance): If a defective product passes inspection, the company fails to reject a false null hypothesis ($H_0$). This could result in unsafe products reaching customers, damaging the brand’s reputation.
Which Error is More Severe?
- It depends on the context.
- In healthcare or safety, Type II errors are often more dangerous.
- In justice or decision-making, Type I errors can be more ethically concerning.
Designing a good hypothesis test involves balancing both types of errors based on what’s at stake.
Learn about Generic Functions in R


