Introduction to SPSS Statistics Software

SPSS is a statistical software package that is used to analyze the data (either in quantitative or qualitative form.) and it also helps to interpret the findings. SPSS stands for Statistical Packages for Social Science.

Introduction to SPSS Statistics

In 2009, SPSS was acquired by IBM. Now, the versions of SPSS are being named “IBM SPSS Statistics”, version 27.

Introduction to SPSS Statistics

SPSS software is used by insurance, banking, telecom, retail, consumer package Goods, market research, health research, survey companies, government (election, population, plan), education system and students researchers, finance, etc. to analyze data. SPSS is capable of analyzing a large amount of data and creating tables and graphs.

SPSS software is used for statistical tests because sometimes it is hard to deal with a large amount of data and perform different mathematical and statistical equations by hand. So, it is helpful for us, it also helps us to interpret the results, check normality, testing of hypotheses, computation of different averages, plot simple to complex graphs, and so on. SPSS offers a wide range of statistical methods. Some examples are:

1) Helps to define and show missing values in the data

Introduction to SPSS Statistics Software

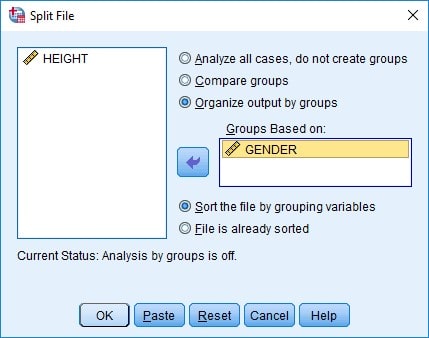
2) Compute Descriptive Statistics such as Frequency Distribution

Analyze > Descriptive statistics > Frequency > statistics

Introduction to SPSS Statistics Software

On entered data, and for selected variables, one may get appropriate and required measures such as mean, sum, mode, percentiles, quartiles, variance, range, and other measures of dispersion, skewness, kurtosis, etc.

Statistical Techniques in SPSS

Descriptive Statistics

Different Statistics can be performed such as Cross Tabulation, Frequency, Descriptive, Explore, and Descriptive Ratio Statistics. All these options contain relevant statistical measures such as measures of central tendency, measures of dispersion, measures of position, measures for identification of shape of distribution, etc.

Inferential Statistics

Inferential statistics from basic to advanced can also be performed in SPSS Software.

Estimation: Confidence Interval (lower and upper limits) and point estimation (single value).

Hypothesis Testing:

Differences Between Groups: Independent Sample t-test, Paired Sample t-test, One-Way ANOVA, Two-Way ANOVA, Chi-Squared Test for Homogeneity, etc.

Correlation Association: Pearson’s Correlation, Spearman Correlation, Chi-Squared Test of Association, Fisher Exact Test of Independence, Odd Ratio, Relative Risk.

Regression Model and Prediction: Linear Regression models, such as Simple and Multiple Regression, Step-Wise Regression, Logistic Regression, Poisson Regression, etc.

Complex Sample and Testing: Compute Statistics and Standard Error by Complex Sample Design, Visualizes and Explores Complex Categorization, Imputes Missing Values through Statistical Algorithms.

Graphs and Data Visualizations: Line, Chart, Histogram, Bar Chart, Pie Chart, Scatter Plot, Box Plot, Area Chart, Q-Q Plot, Simple 3D Bar Chart, Population Pyramid, Frequency Polygon.

So we say that the SPSS software plays a significant role in the process of analyzing and interpreting the data with the help of statistical features and methods.

For different SPSS Software Tutorials, see the following links:

Introduction to R Language

Online MCQs Quiz Website

MCQs MS Excel 2

The post is about MCQs MS Excel which serves as a valuable resource for enhancing skills and preparing for exams such as MS-CIT, entrance exams, and university assessments. This quiz encompasses both fundamental and advanced aspects of MS Excel to assist professionals and students alike. Let us start with MCQs MS Excel.

Online MCQs MS Excel with answers

1. _____ Excel function returns TRUE or FALSE based on two or more conditions


2. ____ is not a function in Excel.


3. The VALUE function converts a numeric value into a text string in a spreadsheet.


4. ____ happens when you select a cell in MS Excel and type “=B25”


5. Which symbol is used to specify the fixed columns or rows in the formula?


6. A data analyst uses the SUM function to add together numbers from a spreadsheet. After getting a zero result, they realize the numbers are text. What function can they use to convert the text to a numeric value?


7. The interface provided by a matrix of rows and columns for manipulation with numeric data is called.


8. A function is created using data values from a specified array. It works correctly only some of the time. You verify that the function was used correctly and you ask a colleague for their input. They ask if you locked the data array. What does this mean?


9. A data analyst locks the rows and columns in their spreadsheet by wrapping their function’s data array in dollar signs ($). Why would they do this?


10. If cells A1 and A2 are empty, what will be the value of the following Excel Formula? =A1 * A2


11. When using VLOOKUP, there are some common limitations that data analysts should be aware of. One of these limitations is that VLOOKUP can only return a value from the data to the left of the matched value.


12. A cell is defined as


13. What happens when you click on CTRL + X after selecting some cells in Excel?


14. _________ is the correct syntax of the IF() Function.


15. When writing a function, a data analyst wraps a table array in dollar signs. This is an _____, which is used to lock the array so rows and columns don’t change if the function is copied.


16. A data analyst creates an absolute reference around a function array. What is the purpose of the absolute reference?


17. ____ type of chart is good for a single series of data.


18. Which option allows you to display all numbers that are less than 0 (negative numbers) in red color in MS Excel?


19. What is an Excel feature that displays only the data in column (s) according to specified criteria?


20. MS Excel function VLOOKUP can have problems when used on data values that have leading and trailing spaces. What function can be used to eliminate these spaces?


Question 1 of 20

Microsoft Excel is a spreadsheet software that is an integral part of the MS Office software Package. A software that is capable of performing calculations from daily life to advanced level. One can perform calculations from basic mathematics to advanced including statistical and financial computations.

Online MCQs MS Excel

Schools, colleges, Universities, and Examination and Testing conducting authorities such as FPSC, NTS, KPPSC, PPSC SPSC, and others, are adding computer MCQs in their test patron to check CIT and computer-related knowledge of the applicants. MCQs MS Excel covers basic topics of Microsoft MS Excel, it especially focuses on MS Excel for statistical computations.

MCQs MS Excel

  • MS Excel function VLOOKUP can have problems when used on data values that have leading and trailing spaces. What function can be used to eliminate these spaces?
  • A function is created using data values from a specified array. It works correctly only some of the time. You verify that the function was used correctly and you ask a colleague for their input. They ask if you locked the data array. What does this mean?
  • A data analyst uses the SUM function to add together numbers from a spreadsheet. After getting a zero result, they realize the numbers are text. What function can they use to convert the text to a numeric value?
  • When using VLOOKUP, there are some common limitations that data analysts should be aware of. One of these limitations is that VLOOKUP can only return a value from the data to the left of the matched value.
  • A data analyst locks the rows and columns in their spreadsheet by wrapping their function’s data array in dollar signs ($). Why would they do this?
  • When writing a function, a data analyst wraps a table array in dollar signs. This is an __________, which is used to lock the array so rows and columns don’t change if the function is copied.
  • The VALUE function converts a numeric value into a text string in a spreadsheet.
  • A data analyst creates an absolute reference around a function array. What is the purpose of the absolute reference?
  • The interface provided by a matrix of rows and columns for manipulation with numeric data is called.
  • A cell is defined as
  • __________ is the correct syntax of the IF() Function.
  • __________ type of chart is good for a single series of data.
  • What is an Excel feature that displays only the data in column (s) according to specified criteria?
  • __________ is not a function in Excel.
  • Excel function returns TRUE or FALSE based on two or more conditions
  • What happens when you click on CTRL + X after selecting some cells in Excel?
  • __________ happens when you select a cell in MS Excel and type “=B25”
  • Which symbol is used to specify the fixed columns or rows in the formula?
  • Which option allows you to display all numbers that are less than 0 (negative numbers) in red color in MS Excel?
  • If cells A1 and A2 are empty, what will be the value of the following Excel Formula? =A1 * A2

Note that most of the questions in the quiz apply to almost all versions of MS Excel. The questions included in the MCQs MS Excel Quizzes are asked as part of the computer operation general knowledge section of the basic computer awareness test.

SPSS Analysis and Statistics for Data Analysts

R Programming

Online MCCQs Test Website

Performing Chi Square test from Crosstabs in SPSS

In this post, we will learn about “performing Chi Square Test” in SPSS Statistics Software. For this purpose, from the ANALYSIS menu of SPSS, the crosstabs procedure in descriptive statistics is used to create contingency tables also known as two-way frequency tables, cross-tabulation, which describe the association between two categories of variables.

In a crosstab, the categories of one variable determine the rows of the contingency table, and the categories of the other variable determine the columns. The contingency table dimensions can be reported as $R\times C$, where $R$ is the number of categories for the row variables, and $C$ is the number of categories for the column variable. Additionally, a “square” crosstab is one in which the row and column variables have the same number of categories. Tables of dimensions $2 \times 2$, $3\times 3$, $4\times 4$, etc., are all square crosstab.

Performing Chi Square Test in SPSS

Let us start performing Chi Square test on cross-tabulation in SPSS, first, click Analysis from the main menu, then Descriptive Statistics, and then Crosstabs, as shown in the figure below

Performing Chi Square Test Crosstabs in SPSS

As an example, we are using the “satisf.sav” data file that is already available in the SPSS installation folder. Suppose, we are interested in finding the relationship between the “Shopping Frequency” and the “Made Purchase” variable. For this purpose, shift any one of the variables from the left pan to the right pan as row(s) and the other in the right pan as column(s). Here, we are taking “Shopping Frequency” as row(s) and “Made Purchase” as column(s) variables. Pressing OK will give the contingency table only.

Crosstabs in SPSS

The ROW(S) box is used to enter one or more variables to be used in the cross-table and Chi-Square statistics. Similarly, the COLUMNS(S) box is used to enter one or more variables to be used in the cross-table and Chi-Square statistics. Note At least one row and one column variable should be used.

The layer box is used when you need to find the association between three or more variables. When the layer variable is specified, the crosstab between the row and the column variables will be created at each level of the layer variable. You can have multiple layers of variables by specifying the first layer variable and then clicking next to specify the second layer variable. Alternatively, you can try out multiple variables as single layers at a time by putting them all in layer 1 of 1 box.

The STATISTICS button will lead to a dialog box that contains different inferential statistics for finding the association between categorical variables.

The CELL button will lead to a dialog box that controls which output is displayed in each crosstab cell, such as observed frequency, expected frequency, percentages, residuals, etc., as shown below.

Crosstabs cell display

Performing Chi Square test on the selected variables, click on the “Statistics” button and choose (tick) the option of “Chi-Square” from the top-left side of the dialog box shown below. Note the Chi-square check box must have a tick in it, otherwise only a cross-table will be displayed.

Crosstabs Chi-Square Statistics in SPSS

Press the “Continue” button and then the OK button. We will get output windows containing the cross-tabulation results in Chi-Square statistics as shown below

Crosstabs output SPSS windows

The Chi-Square results indicate an association between the categories of the “Sopping Frequency” variable and the “Made Purchase” variable since the p-value is smaller than say 0.01 level of significance.

For video lecture on Contingency Table and chi-square statistics, See the video lectures

See another video about the Contingency Table and Chi-Square Goodness of Fit Test

Learn How to perform data analysis in SPSS

Learn R Programming Language